 eAtlas Data Catalogue
Gulf of Carpentaria
Type of resources
Topics
Keywords
Contact for the resource
Provided by
Years
Update frequencies
status
-
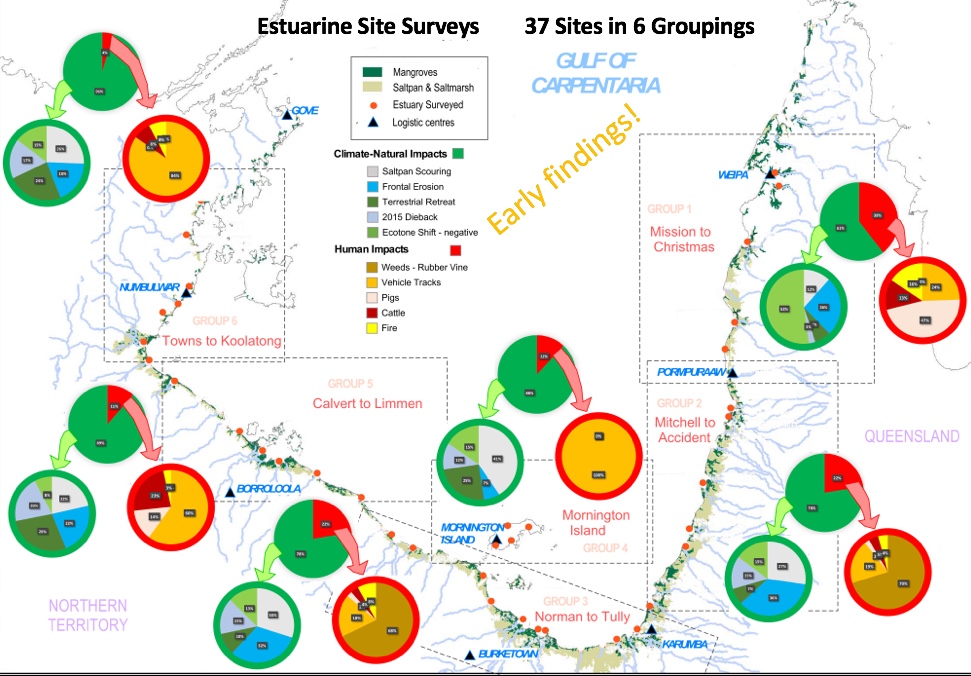
The major estuaries and their tidal wetlands of the Gulf of Carpentaria were impacted by mass dieback of mangroves in 2015-2016. To assess the full extent of the dieback and the major changes in the wetland areas, surveys in 2017 and 2019 were conducted along 31–37 major estuary mouths. Methods: The estuary surveys were conducted during aerial surveys using the same methods generally (see associated metadata record for more details: Gulf of Carpentaria Mangrove Aerial Shoreline Surveys 2017 & 2019 (NESP TWQ 4.13, JCU)). Shoreline edges were filmed and observations scored within a few kilometres of each estuary mouth. The observations recorded included a standard set of 10-20 features related to natural and human associated pressures like storm impacts, shoreline erosion, 2015 dieback of mangroves, fire damage, feral pig damage plus roads and buildings. Observations were summarised for each factor based on extent and severity scores to provide respective rankings of influence. These observations were further linked to respective likely drivers like sea level rise, storm winds, rough seas, plus the human associated ones of fire, pigs and weeds. The surveys collected observational data to classify the state, condition and health of the shoreline using criteria: 1. Driver type: list the drivers of change observed 2. Indicator: the indicator observed 3. Habitat: listing of the tidal wetland habitats affected 4. Extent: estimate the proportion of the tidal wetland affected 5. Severity: estimate severity of impact – time to natural recovery and effect on ecosystem function/structure 6. Time frame: when did the impact occur 7. Observations: notes and other comments These strategies were used to evaluate habitat condition associated with particular drivers, as well as providing an evaluation of local and national management priorities. The follow criteria were used to score the extent, severity and time frame (where applicable) for the criteria: Variable: Extent of impact on the tidal wetlands – The extent of tidal wetlands impacted determined by the proportional area showing impact. Impact extent assessment scoring criteria: 1. 1 – 10% 2. 10 – 30% - around 25% 3. 30 – 60% - around 50% 4. 60 – 90 % - around 75% 5. >90% Assessment metric: Extent score – extent of impact in the tidal wetlands Variable: Severity of impact on tidal wetland area – the severity of tidal wetlands impacted as determined by the degradation state observed. Impact severity assessment scoring criteria: 1. None – present but no observable effect 2. Minor – recovery within less than one year 3. Moderate – recovery over 1 – 2 years 4. Major – recovery over 2 – 10 years 5. Severe – recovery unlikely – collapse/replace Assessment metric: Severity score – severity of impact in the tidal wetlands Variable: Time frame of the impact on tidal wetland area – The timing of the impact on tidal wetlands as determined by the recovery potential observed. Impact time frame Assessment scoring criteria: 1. No observable effect, but potentially so 2. Current – now 3. Recent – less than 2 years ago 4. 4. Old – 2- 10 years ago 5. Very old - >10 years Assessment metric: Time frame score – time of occurrence of impact affecting tidal wetland area. Limitations of the data: Format of the data: This data consists of the survey assessment sheets from each estuary (xlsx) plus summary spreadsheets for each survey year. Each survey assessment sheet presents the original scores for Extent and Severity for each of the variables, as well as the calculations for respective rankings of influence. Note - The rankings of influence was used for the basis of the map visualisation by eAtlas, presenting the combined summary for each survey year as a shapefile. Data dictionary: 2019 Gulf of Carpentaria Tidal Wetland Threat Assessment Sheets: The extent, severity, time frame, restoration potential and other observations were collected for each of the following variables: Human Related Variable Driver Type: Indicator / Habitat Structure Loss: rock walls, wharf, ramps, roads / any zone Direct Loss: clearing, dead trees, landfill / any zone Altered Hydrology: bunds, drains, impoundments / higher zones mostly Encroachment: no buffer, cut-off flows / upper edge zone Access Tracks: wheel tracks, foot paths / Salt pans + high tide margin Stock Impacts: cattle, horses, goats – tracks / Salt pans + high tide margin Feral Damage: pigs, wallows, digging and tracks / Salt pan mangrove + freshwater wetlands Pollutant impact: oil spill, scum, dump, dieback / any zone Nutrient Excess: enhanced growth, expansion / any zone Fire Scorch: burnt vegetation - grass, dieback, blackened / upper margin - fringing zone Weed Smother: smothering weeds present / Beach ridge veg - mangrove upper edges Climate-natural Variable Driver Type: Indicator / Habitat Storm Damage: broken stems, damaged canopies, dead trees / mangrove closed canopies Shoreline erosion: fallen trees, steep bank, dieback / seaward + main channel edge stands of mangroves Root Burial: dead trees, burying sediments /shoreline and sea edge mangroves Inner Fringe Collapse: patchy dieback, canopy gaps / waters edge canopies Bank Erosion: channel edges eroded, fallen trees, steep / lower estuary banks Pan Scouring: upper pan, eroded edges, sheet erosion / upper salt pans Ecotone Shift -ve: dead trees pan edges / saltpan – mangrove Ecotone Shift +ve: new growth – seedlings, saplings / saltpan – mangrove Depositional gain: new growth – seedlings, saplings / waters edge margins Terretrial Retreat: dead terrestrial edge trees, eroded edge /terrestrial fringe Light gaps: dead trees, circular patch / mangrove closed canopies Altered hydrology: impounded, ponded water, dead trees /shoreline and sea edge mangroves 2015 Dieback: dead trees on back front edge / rear of mangrove front 2017 Gulf of Carpentaria Tidal Wetland Threat Assessment Sheets: Driver Type: Indicator / Habitat Pigs: wallows, pigs and tracks / inner mangrove + freshwater wetlands Fire: burnt vegetation – grass / Terrestrial margin - fringing mangroves Vehicle tracks: wheel tracks / Salt pans + high tide edge Cattle: cattle and tracks / Salt pans + high tide edge Weeds: weed species present / Beach ridge veg. / to mangrove upper edges 2015 Dieback: dead trees on pan edges / mangrove closed canopies Ecotone Shift: dead trees on pan edges / AM + Ceriops closed canopies Terretrial Retreat: dead terrestrial edge trees / Terrestrial fringe Saltpan scouring: eroded edges – escarpments / upper saltpans Light gaps: dead trees in a small circular patch / mangrove closed canopies Storm Damage: damaged canopies, dead trees / Mangrove closed canopies Depositional gain: new growth - seedlings. Saplings / waters edge margins Shoreline erosion: inner fringe collapse / seaward + main channel edge stands of mangroves Bank Erosion: channel edges eroded / lower estuary banks Altered hydrology: impounded, ponded water, dead trees / shoreline and sea edge mangroves Root Burial: dead trees and mobile sediments / shoreline and sea edge mangroves Note in some cases similar terminology was used for the same attribute for the different survey years, i.e. Access Tracks = Vehicle tracks, Stock impacts = cattle, Feral Damage = pigs. Data Dictionary - Shapefile Attributes Shapefile Attributes / Data Attribute: Description CATCHMENT/CATCHMENT: Catchment name. Estuaries are grouped in catchment areas described in the CSIRO Northern Australia Sustainable Project [CSIRO (2009) Water in the Gulf of Carpentaria Drainage Division. A report to the Australian Government from the CSIRO Northern Australia Sustainable Yields Project. CSIRO Water for a Healthy Country Flagship, Australia. xl + 479pp] SITE_NO/SITE_NO Number allocated to the site NAME/LOCATION_NAME: Location name REPEAT SURVEY/REPEAT SURVEY: whether the survey was repeated in 2019 (Y) or not (N) LATITUDE/LATITUDE: Latitude of the survey location. Coordinates mark the location of each estuary mouth. LONGITUDE/LONGITUDE: Longitude of the survey location. Coordinates mark the location of each estuary mouth. MANGROVE_S/MANGROVE_SPP_NO: Number of observed mangrove species for the location. S19-HUMAN/HUMAN_ISSUES: Total score of all Human threat issues for the 2019 survey assessment. Indicates the combined entent and severity scores across all the human issues and gives an idea of which areas are most impacted for this category. S19-CLIMATE/CLIMATE _ISSUES: Total score of all Climate threat issues for the 2019 survey assessment. Indicates the combined entent and severity scores across all the human issues and gives an idea of which areas are most impacted for this category. S19_S_LOSS/2019_STRUCTURE_LOSS Rock walls, wharf, ramps, roads found on any habitat zone. Extent and severity were assessed according to fixed criteria, and the Extent*Severity summary score combined shows the respective rankings of influence. S19_D_LOSS/2019_DIRECT_LOSS: Clearing, dead trees, landfill found on any habitat zone. Extent and severity were assessed according to fixed criteria, and the Extent*Severity summary score combined shows the respective rankings of influence. S19_ALT_HY/2019_ALTERED_HYDROLOGY: Bunds, drains, impoundments on the higher zones mostly. Extent and severity were assessed according to fixed criteria, and the Extent*Severity summary score combined shows the respective rankings of influence. S19_ENCROA/2019_ENCROACHMENT: No buffer, cut-off flows on the upper edge habitat zone. Extent and severity were assessed according to fixed criteria, and the Extent*Severity summary score combined shows the respective rankings of influence. S19_TRACKS/2019_ACCESS_TRACKS: Wheel tracks and/or foot paths on the Salt pans & high tide margin. Extent and severity were assessed according to fixed criteria, and the Extent*Severity summary score combined shows the respective rankings of influence. S19_STOCK/2019_STOCK_IMPACTS: Cattle, horse or goats tracks on the Salt pans & high tide margin. Extent and severity were assessed according to fixed criteria, and the Extent*Severity summary score combined shows the respective rankings of influence. S19_FERAL/2019_FERAL_DAMAGE: Pigs, wallows, digging and tracks on the Salt pan mangrove & freshwater wetlands. Extent and severity were assessed according to fixed criteria, and the Extent*Severity summary score combined shows the respective rankings of influence. S19_POLLUT/2019_POLLUTANT_IMPACT: Oil spill, scum, dump, dieback found in any habitat zone. Extent and severity were assessed according to fixed criteria, and the Extent*Severity summary score combined shows the respective rankings of influence. S19_NUTRI/2019_NUTRIENT_EXCESS: Enhanced growth, expansion in any habitat zone. Extent and severity were assessed according to fixed criteria, and the Extent*Severity summary score combined shows the respective rankings of influence. S19_FIRE/2019_FIRE_SCORCH: Burnt vegetation (grass, dieback, blackened / upper margin) on the fringing zone. Extent and severity were assessed according to fixed criteria, and the Extent*Severity summary score combined shows the respective rankings of influence. S19_WEED/2019_WEED_SMOTHER: Smothering weeds present on the beach ridge vegetation - mangrove upper edges. Extent and severity were assessed according to fixed criteria, and the Extent*Severity summary score combined shows the respective rankings of influence. S19_STORM/2019_STORM_DAMAGE: Broken stems, damaged canopies or dead trees in the mangrove closed canopies. Extent and severity were assessed according to fixed criteria, and the Extent*Severity summary score combined shows the respective rankings of influence. S19_S_EROS/2019_SHORELINE_EROSION: Fallen trees, steep bank, dieback at seaward and main channel edge stands of mangroves. Extent and severity were assessed according to fixed criteria, and the Extent*Severity summary score combined shows the respective rankings of influence. S19_ROOT_B/2019_ROOT_BURIAL: Dead trees and burying sediments on the shoreline and sea edge mangroves. Extent and severity were assessed according to fixed criteria, and the Extent*Severity summary score combined shows the respective rankings of influence. S19_FRINGE/2019_INNER_FRINGE_COLLAPSE: Patchy dieback, canopy gaps at thewaters edge canopies. Extent and severity were assessed according to fixed criteria, and the Extent*Severity summary score combined shows the respective rankings of influence. S19_B_EROS/2019_BANK_EROSION: Channel edges eroded, fallen trees, steep lower estuary banks. Extent and severity were assessed according to fixed criteria, and the Extent*Severity summary score combined shows the respective rankings of influence. S19_PAN_SC/2019_PAN_SCOURING: Upper pan, eroded edges and/or sheet erosion on the upper salt pans. Extent and severity were assessed according to fixed criteria, and the Extent*Severity summary score combined shows the respective rankings of influence. S19_NEG_ES/2019_NEG_ECOTONE_SHIFT: Dead trees pan edges on the saltpan – mangrove habitat. Extent and severity were assessed according to fixed criteria, and the Extent*Severity summary score combined shows the respective rankings of influence. S19_POS_ES/2019_POS_ECOTONE_SHIFT: New growth – seedlings or saplings on the saltpan – mangrove habitat. Extent and severity were assessed according to fixed criteria, and the Extent*Severity summary score combined shows the respective rankings of influence. S19_D_GAIN/2019_DESPOSITIONAL_GAIN: New growth – seedlings, saplings at the waters edge margins. Extent and severity were assessed according to fixed criteria, and the Extent*Severity summary score combined shows the respective rankings of influence. S19_TERRE/2019_TERRETRIAL_RETREAT: Dead terrestrial edge trees or eroded edge on the terrestrial fringe. Extent and severity were assessed according to fixed criteria, and the Extent*Severity summary score combined shows the respective rankings of influence. S19_L_GAPS/2019_LIGHT_GAPS: Dead trees or circular patch on mangrove closed canopies. Extent and severity were assessed according to fixed criteria, and the Extent*Severity summary score combined shows the respective rankings of influence. S19_ALT_HY/2019_ALTERED_HYDROLOGY: Bunds, drains, impoundments on the higher zones mostly. Extent and severity were assessed according to fixed criteria, and the Extent*Severity summary score combined shows the respective rankings of influence. S19_2015_D/2019_2015_DIEBACK: Dead trees on back front edge of the rear of mangrove front. Extent and severity were assessed according to fixed criteria, and the Extent*Severity summary score combined shows the respective rankings of influence. S17_TRACKS/2017_ACCESS_TRACKS: Wheel tracks and/or foot paths on the Salt pans & high tide margin. Extent and severity were assessed in the 2017 survey according to fixed criteria, and the Extent*Severity summary score combined shows the respective rankings of influence. S17_STOCK/2017_STOCK_IMPACTS: Cattle, horse or goats tracks on the Salt pans & high tide margin. Extent and severity were assessed according to fixed criteria, and the Extent*Severity summary score combined shows the respective rankings of influence. S17_FERAL/2017_FERAL_DAMAGE: Pigs, wallows, digging and tracks on the Salt pan mangrove & freshwater wetlands. Extent and severity were assessed according to fixed criteria, and the Extent*Severity summary score combined shows the respective rankings of influence. S17_FIRE/2017_FIRE_SCORCH: Burnt vegetation (grass, dieback, blackened / upper margin) on the fringing zone. Extent and severity were assessed according to fixed criteria, and the Extent*Severity summary score combined shows the respective rankings of influence. S17_WEED/2017_WEED_SMOTHER: Smothering weeds present on the beach ridge vegetation and mangrove upper edges. Extent and severity were assessed according to fixed criteria, and the Extent*Severity summary score combined shows the respective rankings of influence. S17_STORM/2017_STORM_DAMAGE: Broken stems, damaged canopies or dead trees in the mangrove closed canopies. Extent and severity were assessed according to fixed criteria, and the Extent*Severity summary score combined shows the respective rankings of influence. S17_S_EROS/2017_SHORELINE_EROSION: Fallen trees, steep bank, dieback at seaward and main channel edge stands of mangroves. Extent and severity were assessed according to fixed criteria, and the Extent*Severity summary score combined shows the respective rankings of influence. S17_ROOT_B/2017_ROOT_BURIAL: Dead trees and burying sediments on the shoreline and sea edge mangroves. Extent and severity were assessed according to fixed criteria, and the Extent*Severity summary score combined shows the respective rankings of influence. S17_B_EROS/2017_BANK_EROSION: Channel edges eroded, fallen trees, steep on the lower estuary banks. Extent and severity were assessed according to fixed criteria, and the Extent*Severity summary score combined shows the respective rankings of influence. S17_PAN_SC/2017_PAN_SCOURING: Upper pan, eroded edges and/or sheet erosion on the upper salt pans. Extent and severity were assessed according to fixed criteria, and the Extent*Severity summary score combined shows the respective rankings of influence. S17_NEG_ES/2017_NEG_ECOTONE_SHIFT: Dead trees pan edges on the saltpan – mangrove habitat. Extent and severity were assessed according to fixed criteria, and the Extent*Severity summary score combined shows the respective rankings of influence. S17_POS_ES/2017_POS_ECOTONE_SHIFT: New growth – seedlings or saplings on the saltpan – mangrove habitat. Extent and severity were assessed according to fixed criteria, and the Extent*Severity summary score combined shows the respective rankings of influence. S17_D_GAIN/2017_DESPOSITIONAL_GAIN: New growth – seedlings, saplings at the waters edge margins. Extent and severity were assessed according to fixed criteria, and the Extent*Severity summary score combined shows the respective rankings of influence. S17_TERRE/2017_TERRETRIAL_RETREAT: Dead terrestrial edge trees or eroded edge on the terrestrial fringe. Extent and severity were assessed according to fixed criteria, and the Extent*Severity summary score combined shows the respective rankings of influence. S17_L_GAPS/2017_LIGHT_GAPS: Dead trees or circular patch on mangrove closed canopies. Extent and severity were assessed according to fixed criteria, and the Extent*Severity summary score combined shows the respective rankings of influence. S17_ALT_HY/2017_ALTERED_HYDROLOGY: Impounded, ponded water or dead trees on the shoreline and sea edge mangroves - Extent and severity were assessed according to fixed criteria, and the Extent*Severity summary score combined shows the respective rankings of influence. S17_2015_D/2017_2015_DIEBACK: Dead trees on back front edge of the rear of mangrove front - Extent and severity were assessed according to fixed criteria, and the Extent*Severity summary score combined shows the respective rankings of influence. References: Duke N.C., Mackenzie J., Kovacs J., Staben G., Coles, R., Wood A., & Castle Y. (2020). Assessing the Gulf of Carpentaria mangrove dieback 2017–2019. Volume 1: Aerial surveys. James Cook University, Townsville, 226 pp. eAtlas Processing: The original data were provided as excel spreadsheets. No modifications to the underlying data were performed and the data package are provided as submitted. The mapping product was generated based on the workbook 'GULF_Threat_Summary #2.xlsx' particularly the '2017-2019' tab & '2019_Gulf Threats ALL' tab (Human_Issues & Climate_Issues data columns). These figures were copied to a new csv file and formatted to optimise visualisation on the map. Columns not recorded during the 2017 survey were removed from the dataset to reduce the scroll length when observing the table associated with each point. Descriptions presented here are derived from information from the final report by the eAtlas team. Location of the data: This dataset is filed in the eAtlas enduring data repository at: data\\custodian\4.13_Assessing-gulf-mangrove-dieback